We are delighted to help clients and governments, to accelerate the pace and scale of solutions to accomplish net-zero targets by leveraging energy expertise, data management, holistic assessment and embracing new and available technology with cost-effectively approach.
How are we helping customers decarbonize operations and increase profitability ?
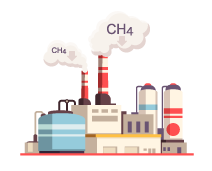
Minimize Fugitive Emissions
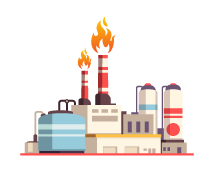
Eliminate or Reduce Flaring
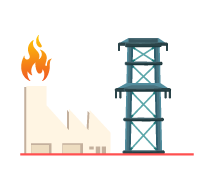
Gas to Power
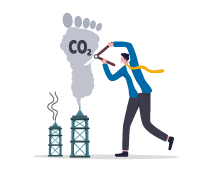
Minimize Drilling Rig and Frack Fleets CO2 Footprint
View of Methane Emissions and Gas Flaring from Satellites
Climate challenge is an energy challenge, certainly the Oil & Gas Industry is under pressure to reduce emissions. Methane emissions in flaring operations require urgent measures to abate.
*150 billion m3 of gas in 2019 flared worldwide, equivalent to more than 400 million tons of CO2. Middle East, North and Sub-Saharan Africa region accounts by 46% of the world’s gas flaring with 68 billion cubic meters or equivalent to 6.670 billion SCFD.*
( *Global Gas Flaring Tracker Report, July 2020, World Bank. )
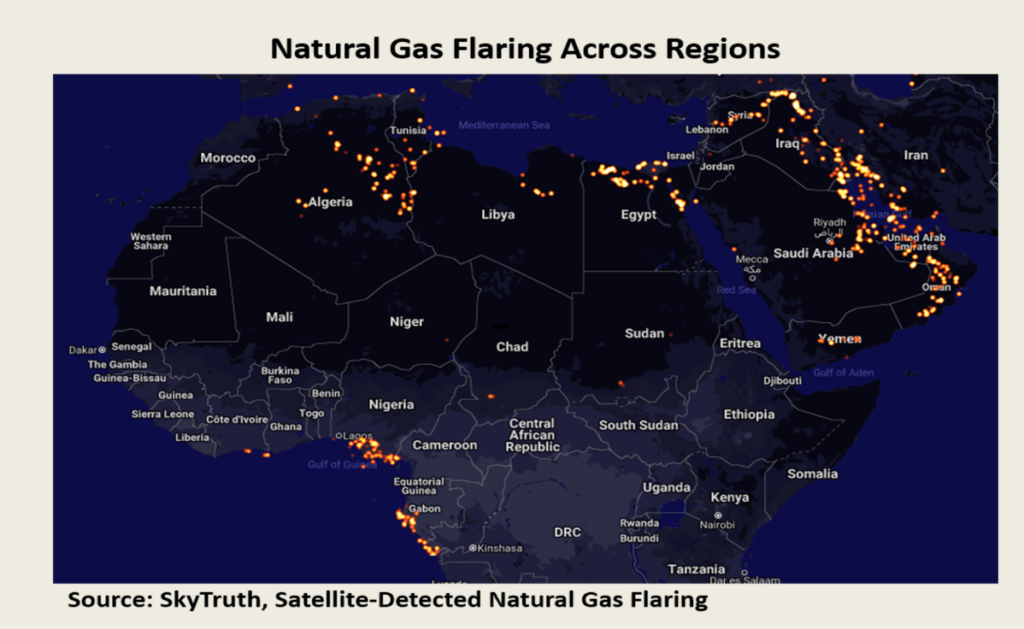
SkyTruth.org flaring map shows the heatmap of nighttime in Middle East, North and Sub-Sharan Africa.
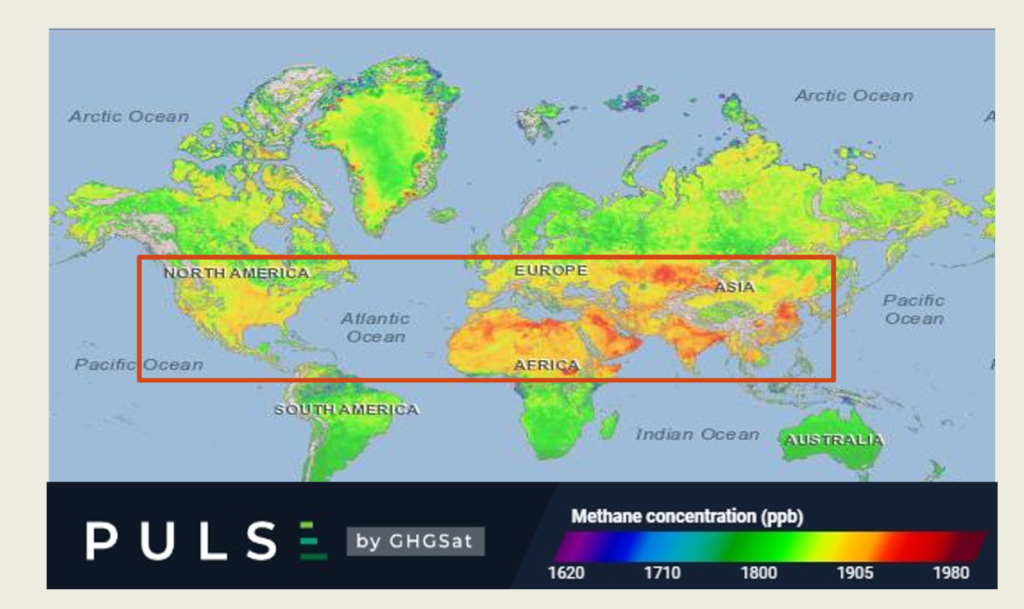
PULSE by GHG Sat displays the Methane concentration worldwide.