GHG Emissions Highlight #3

Today’s edition of CASIUS highlights what is happening with the spatial distribution of methane emissions on the planet using various websites with real-time data. Such maps are critical for monitoring changes in greenhouse gas emissions because the data tells us how fast atmospheric concentrations are rising, where to look and where to expect the most emissions releases.

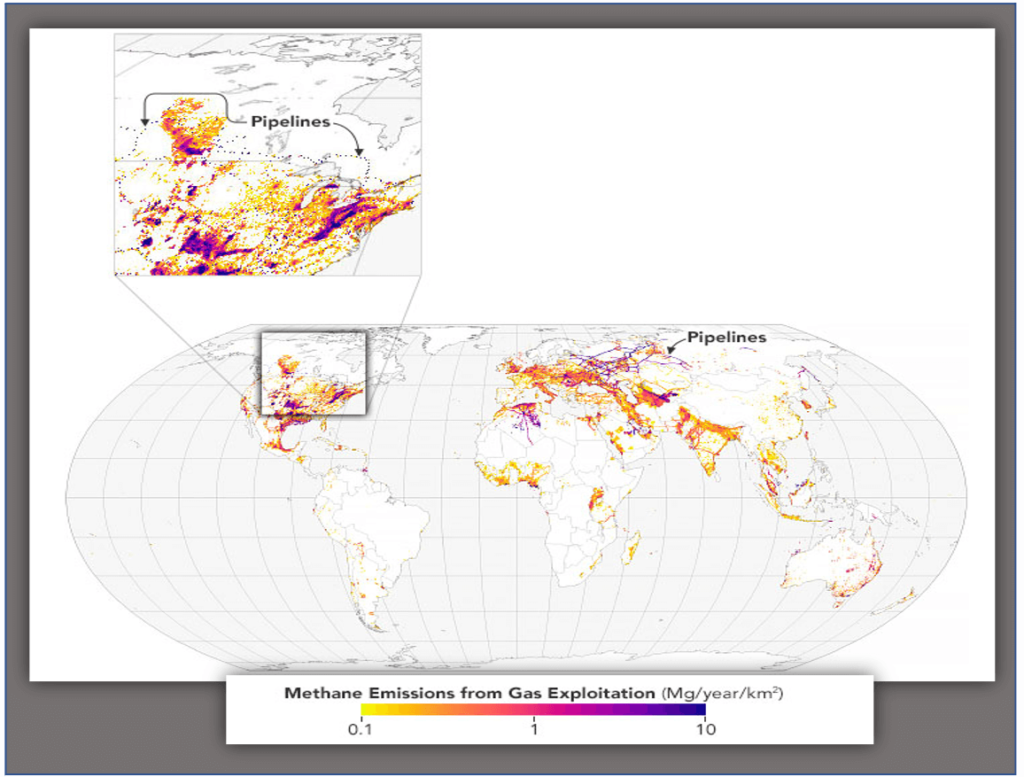
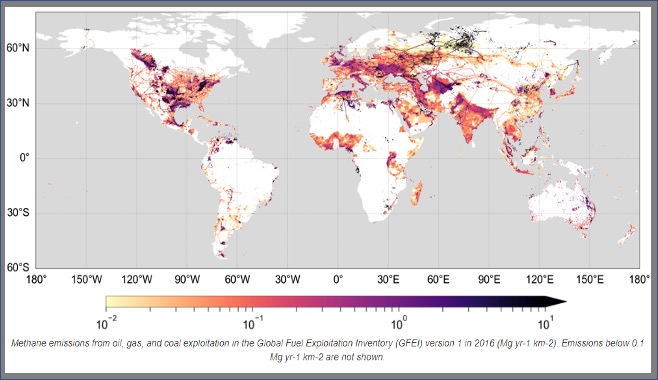
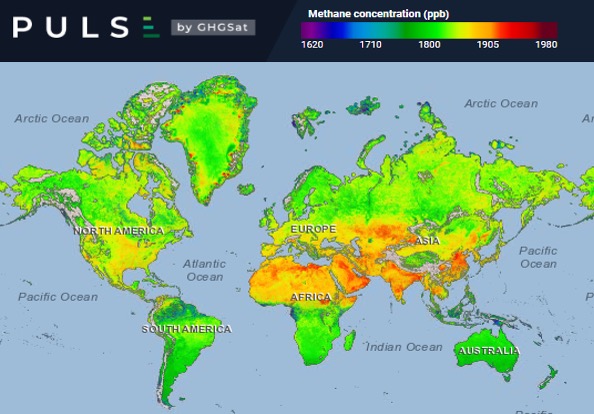
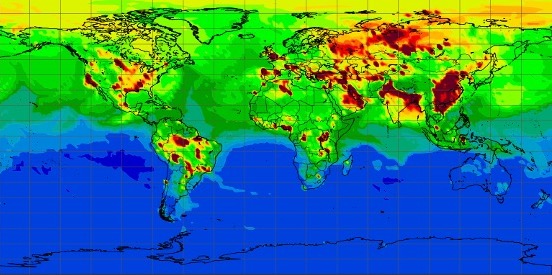
This edition shows the spatial representation of methane emissions from satellites such as – The Global Inventory of Methane Emissions from Fuel Exploitation (GFEI) created by the NASA Carbon Monitoring System (CMS) -, – PULSE Map of GHGSat -, and – Methane forecasts provided by CAMS, the Copernicus Atmosphere Monitoring Service -.

NASA’s Carbon Monitoring System

Methane emissions from fossil fuel production
  • NASA’s Carbon Monitoring System, scientists recently built a new series of maps detailing the geography of methane emissions from fossil fuel production.
  • Using publicly available data reported in 2016, the research team plotted fuel exploitation emissions—or “fugitive emissions” as the UNFCCC calls them—that arise before the fuels are ever consumed.
  • The maps delineate where these emissions occur based on the locations of coal mines, oil and gas wells, pipelines, refineries, and fuel storage and transportation infrastructure.
  • The maps were recently published at NASA’s Goddard Earth Sciences Data and Information Services Center (GES DISC). (Note that 2016 was the most recent year with complete UN emissions data available at the time of this study.).

NASA’s Carbon Monitoring System

Global Inventory of Methane Emissions from Fuel Exploitation (GFEI)
  • Global inventory of methane emissions from fuel exploitation (GFEI) created for the NASA Carbon Monitoring System (CMS).
  • Emissions are allocated to infrastructure locations including mines, wells, pipelines, compressor stations, storage facilities, processing plants, and refineries.
  • The emission sources represented in this dataset include fugitive emission sources from oil, gas, and coal exploitation following IPCC 2006 definitions and are estimated using bottom-up methods. The inventory emissions are based on individual country reports submitted in accordance with the United Nations Framework Convention on Climate Change (UNFCCC).
  • For those countries that do not report, the emissions are estimated following IPCC 2006 methods.

PULSE Map by GHGSat

April 11, 2020
  • PULSE combines data from GHGSat and multiple sources to quantify methane concentrations worldwide
  • PULSE Map displaying the methane concentration worldwide, the scale in part per billion shows that all the places in red are over 1905 part per billion of methane concentration.
  • Low methane concentration due to the lockdown.

PULSE Map by GHGSat

Jan 23, 2021
  • PULSE combines data from GHGSat and multiple sources to quantify methane concentrations worldwide
  • PULSE Map displaying the methane concentration worldwide, the scale in part per billion shows that all the places in red are over 1905 part per billion of methane concentration.
  • Showing a higher methane concentration than April 11, 2020

PULSE Map by GHGSat

Jan 22, 2022
  • PULSE combines data from GHGSat and multiple sources to quantify methane concentrations worldwide
  • PULSE Map displaying the methane concentration worldwide, the scale in part per billion shows that all the places in red are over 1905 part per billion of methane concentration.
  • Looking at the movie-like trend, a higher methane concentration is observed than a year ago, January 23, 2021.

Methane Forecasts Provided by CAMS

Methane at surface [ ppbv ] (provided by CAMS, the Copernicus Atmosphere Monitoring Service) Wednesday 26 Jan, 00 UTC T+102 Valid: Sunday 30 Jan, 06 UTC
Total column of methane [ ppbv ] (provided by CAMS, the Copernicus Atmosphere Monitoring Service) CAMS methane forecasts
  • CAMS, the Copernicus Atmosphere Monitoring Service, implemented by the European Centre for Medium-Range Weather Forecasts on behalf of the European Commission, has a vital role to play in monitoring and forecasting greenhouse gas concentrations.
  • CAMS uses observations from both satellites and ground-based measurement stations to monitor atmospheric CH4 concentrations. This tells us how quickly atmospheric concentrations are increasing.
  • Methane map at surface displaying several hotspot of 2,320 ppbv (part per billion per volume) of methane concentration.